
Like Wireshark, but for Kubernetes.
v1.0 — stable
Apache-2.0
macOS · Linux · Windows
Like Wireshark, but for Kubernetes.
Capture a Kubernetes cluster's state over time into a single portable archive, then replay it
through a built-in mock API server — query a customer's environment with kubectl and a
web dashboard, with no live cluster access required.
# Homebrew
brew install --cask phenixblue/tap/k8shark

# or with Go
go install github.com/phenixblue/k8shark@latest
macOS: Homebrew quarantines cask installs, so the first run is blocked by Gatekeeper. Approve it once under System Settings → Privacy & Security, or clear the attribute yourself — see the install notes.
# Capture a live cluster — no config file needed
kshrk capture --auto-discover --duration 2m --out capture.kshrk

# Ask what's broken, entirely offline
kshrk diagnose capture.kshrk
Then explore it. Both options below run in the foreground until you press Ctrl+C, so pick one rather than pasting both.
# Option A — query it with kubectl
kshrk open capture.kshrk --kubeconfig-out ~/.kube/k8shark-demo.yaml

# ...then, in a second shell — absolute, so any directory works:
export KUBECONFIG=~/.kube/k8shark-demo.yaml
kubectl get pods -A

# Option B — browse it in the dashboard shown below (prints a local URL)
kshrk ui capture.kshrk
--auto-discover captures every API resource your credentials can read, which is the
fastest way to a first archive. For repeatable or scoped captures — specific resources,
namespaces, and poll intervals — use a config file instead: see
the config reference
and the starter config.
No cluster handy? The repo ships
five pre-recorded captures
you can open immediately.

Capture a live cluster, then run kubectl against the archive — no cluster required.
kshrk capture polls the Kubernetes API at set intervals — and watches for changes — packaging every response into a single .kshrk archive.
kshrk open starts a local mock HTTPS API server and writes a kubeconfig — point kubectl at it and explore.
Browse the capture in the built-in web dashboard, time-travel through the window, and diff snapshots — all offline.
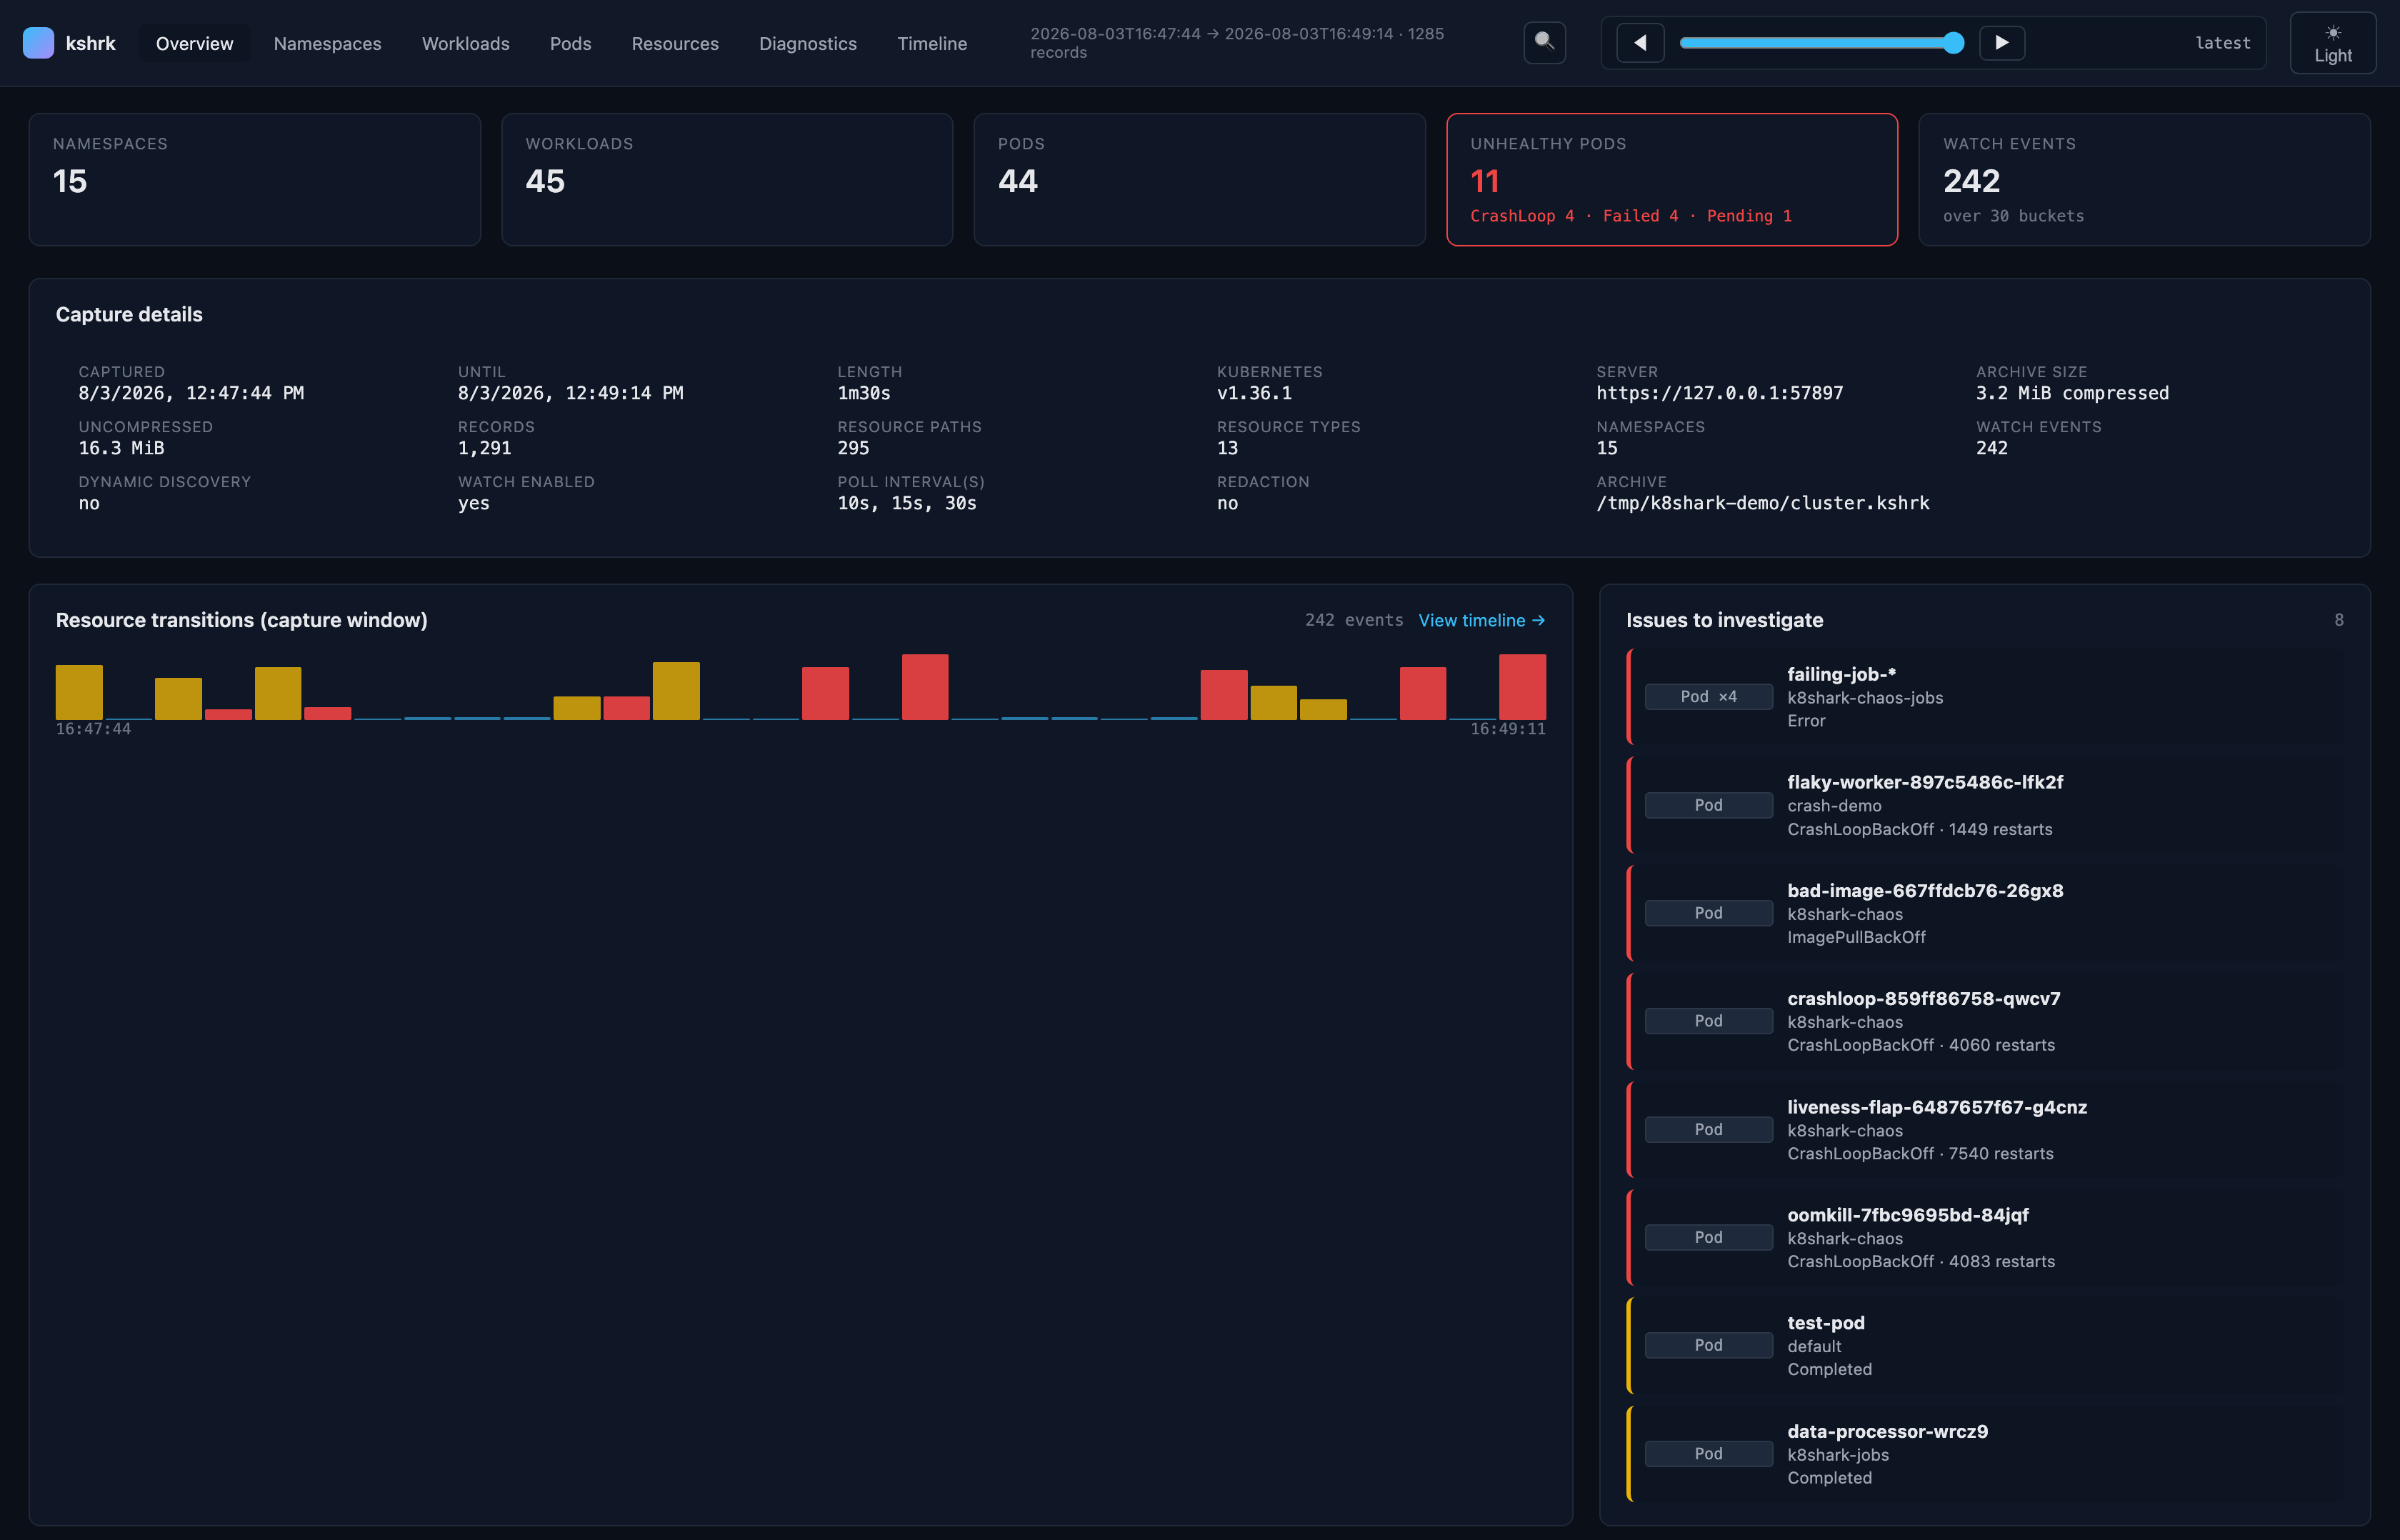
Cluster totals, capture provenance, a watch-event timeline, and the pods worth looking at first.